Radiology. Cardiothoracic Imaging
Radiological Society of North America
Ran Yang, Xiang Li, […], and Wenbing Zeng
Additional article information
Abstract
article-meta
Background
Quantitative and semi-quantitative indicators to evaluate the severity of lung inflammation in Coronavirus Disease 2019 (COVID-19) could provide an objective approach to rapidly identify patients in need of hospital admission.
Purpose
To evaluate the value of chest computed tomography severity score (CT-SS) in differentiating clinical forms of COVID-19.
Materials and Methods
Inclusion of 102 patients with COVID-19 confirmed by positive real-time reverse transcriptase polymerase chain reaction on throat swabs underwent chest CT (53 men and 49 women, 15-79 years old, 84 cases with mild and 18 cases with severe disease). The CT-SS was defined by summing up individual scores from 20 lung regions; scores of 0, 1, and 2 were respectively assigned for each region if parenchymal opacification involved 0%, less than 50%, or equal or more than 50% of each region (theoretical range of CT-SS from 0 to 40). The clinical and laboratory data were collected, and patients were clinically subdivided according to disease severity by the Chinese National Health Commission guidelines.
Results
The posterior segment of upper lobe (left, 68/102; right, 68/102), superior segment of lower lobe (left, 79/102; right, 79/102), lateral basal segment (left, 79/102; right, 70/102) and posterior basal segment of lower lobe (left, 81/102; right, 83/102) were the most frequently involved sites in COVID-19. Lung opacification mainly involved the lower lobes, in comparison with middle-upper lobes. No significant differences in distribution of the disease were seen between right and left lungs. The individual scores of in each lung, as well as the total CT-SS were higher in severe COVID-19 when compared with mild cases (P<0.05. The optimal CT-SS threshold for identifying severe COVID-19 was 19.5 (area under curve, 0.892), with 83.3% sensitivity and 94% specificity.
Conclusion
CT-SS could be used to quickly and objectively evaluate the severity of pulmonary involvement in COVID-19 patients.
Summary
The chest CT severity score could be used to rapidly identify patients with severe forms of COVID-19.
Key Results
list-behavior=simple prefix-word= mark-type=none max-label-size=0
■ The dominant distribution of COVID-19 pneumonia is bilateral and posterior.
■ The proposed pulmonary inflammation load score was higher in patients with severe COVID-19 in comparison with patient with mild disease.
■ The optimal inflammation load score threshold for identifying severe patients was 19.5, with 83.3% sensitivity and 94% specificity.
Introduction
Since December 2019, a cluster of cases with unknown pneumonia with similar clinical manifestations suggesting viral pneumonia appeared in Wuhan City, Hubei Province, China. A new type of coronavirus was isolated from the lower respiratory tract samples, named Severe Acute Respiratory Syndrome Coronavirus-2 (SARS-CoV-2) by the International Virus Classification Commission [1]. The disease it causes was named Coronavirus Disease 2019 (COVID-19) by WHO in February 11, 2020 [2]. SARS-CoV-2 belong to β-coronavirus, which is a typical RNA virus. It is generally round or oval shaped, with a diameter of 60 to 140 nm under the electron microscope. Its outer membrane had unique spikes, about 9 to 12 nm, similar to the solar corona [3]. The study found that the SARS-CoV-2 shares 92% homology with the bat coronavirus sequence RaTG3, which suggests a zoonotic origin for this outbreak [4]. SARS-CoV-2 can spread from person-to-person [5] and has been declared a pandemic disease. The common clinical symptoms of patients with COVID-19 are fever, cough, dyspnea and fatigue, which are similar to those of severe acute respiratory syndrome coronavirus (SARS-CoV) and Middle East respiratory syndrome coronavirus (MERS-CoV) [6,7]. Severe cases can lead to acute respiratory distress syndrome, or even death. According to the severity of the patient’s condition, the treatment is different. Mild patients receive antiviral, symptomatic support and oxygen therapy. However, severe cases need to be admitted to intensive care unit as soon as possible.
At present, the diagnosis of COVID-19 depends on real-time reverse transcriptase polymerase chain reaction (RT RT-PCT) or next-generation sequencing [8]. On imaging, computed tomography (CT) manifestations resemble those seen in viral pneumonias [9], with multifocal ground-glass opacities and consolidation in a peripheral distribution being the most common findings [10,11]. Although these findings lack specificity for COVID-19 diagnosis on imaging grounds, we hypothesize that CT could be used to provide objective assessment about the extension of the lung opacities, which could be used as an imaging surrogate for disease burden. The main purpose of our study was to evaluate the performance and inter-reader concordance of a semi-quantitative CT severity score designed to identify severity of COVID-19. If feasible, such approach could expedite the identification and management of severe patients in specific instances where a fast triage method is needed.
Materials and Methods
Patients and Groups
The study was approved by the Ethics Committee of Chongqing Three Gorges Central Hospital. We retrospectively studied the patients who were diagnosed with COVID-19 from January 21, 2020 to February 5, 2020 in our hospital. According to our hospital protocol, all patients with suspected COVID-19 routinely underwent non-contrast CT examinations and were admitted in hospital for isolation and observation. CT was chosen over chest radiographs based on the assumption that the former is more sensitive to detect lung opacities.
A total of 102 patients with COVID-19 were confirmed by RT RT-PCR throat swab [12]. Patients with lung malignancy, a history of lobectomy, tuberculosis, or atelectasis were excluded from this study. According to the “Diagnosis and Treatment Program of Pneumonia of New Coronavirus Infection (Trial Fifth Edition)” [13] recommended by China’s National Health Commission on February 5, 2020, COVID-19 patients are classified as having minimal, common, severe and critical. Minimal disease patients have subtle clinical symptoms and no lung opacities on chest imaging and have been excluded from further analyses in this study. Common cases have symptoms such as fever and respiratory tract, and chest imaging showing lung opacities. Severe cases should meet any of the following criteria:
list-behavior=simple prefix-word= mark-type=none max-label-size=3
(1)
respiratory distress, RR ≥ 30 beats / min;
(2)
resting blood oxygen saturation ≤ 93%; or
(3)
partial pressure of arterial blood oxygen (PaO2) / oxygen concentration (FiO2) ≤ 300 mmHg.
Critical patients need to meet one of the following conditions:
list-behavior=simple prefix-word= mark-type=none max-label-size=3
(1)
respiratory failure and need mechanical ventilation;
(2)
shock;
(3)
other organ failure needing ICU monitoring treatment.
For the purposes of this study, common cases were included in the Mild Disease group, while severe and critical cases were merged into the Severe Disease group, because of the small number of cases in the latter category (n = 3).
Chest CT Severity Score Assessment
We developed a chest CT severity score (CT-SS) for assessing COVID-19 burden on the initial scan obtained at admission. This score uses lung opacification as a surrogate for extension of the disease in the lungs. The CT-SS is an adaptation of a method previously used to describe ground-glass opacity, interstitial opacity, and air trapping, which was correlated with clinical and laboratory parameters in patients after SARS [14]. According to the anatomical structure, the 18 segments of both lungs were divided into 20 regions, in which the posterior apical segment of the left upper lobe was subdivided into apical and posterior segmental regions, while the anteromedial basal segment of the left lower lobe was subdivided into anterior and basal segmental regions. The lung opacities in all of the 20 lung regions were subjectively evaluated on chest CT using a system attributing scores of 0, 1, and 2 if parenchymal opacification involved 0%, less than 50%, or equal or more than 50% of each region. The CT-SS was defined as the sum of the individual scored in the 20 lung segment regions, which may range from 0 to 40 points.
All CT images were independently reviewed by two chest radiologists with more than 10 years of experience, blinded to the clinical data and laboratory indicators, in a standard clinical Picture Archiving and Diagnostic System workstation. All thin-section CT scans were reviewed at a window width and level of 1000 to 2000 HU and -700 to -500 HU, respectively, for lung parenchyma.
Chest CT Scan
Chest CT imaging was performed on a 16-detector CT scanner (Emotion; SIEMENS). All patients were examined in supine position. CT images were then acquired during a single inspiratory breath-hold. The scanning range was from the apex of lung to costophrenic angle. CT scan parameters: X-ray tube parameters – 120KVp, 350mAs; rotation time – 0.5 second; pitch – 1.0; section thickness – 5 mm; intersection space – 5 mm; additional reconstruction with sharp convolution kernel and a slice thickness of 1.5 mm.
Statistical Analysis
Statistical analysis was performed using R (version 3.5.1). P<0.05 was regarded to demonstrate statistical significance. Quantitative data were expressed as mean ± standard deviation or median and interquartile range. The Weighted Kappa coefficient was used to compare the consistency of two observers in each lung segment. Interrater reliability was evaluated using intraclass correlation coefficient (ICCs) for continuous variables (ICCs was classified as follows: no agreement, 0-0.2; weak agreement, 0.21-0.4; moderate agreement, 0.41-0.60; good agreement, 0.61-0.80; and excellent agreement, 0.81-1.0). All measurements were assessed with normality tests. A Chi square or Fisher exact test was used to compare the scores of each lung segment between the mild and severe groups. A Wilcoxon rank sum test was used to compare the difference of left lung, right lung and total score between the mild group and the severe group, and the Wilcoxon matched-pairs signed-rank test was used to compare the difference of scores between lower lung and middle-upper lung, left lung and right lung. Receiver operator characteristic (ROC) curve analysis was performed to calculate the threshold, specificity, sensitivity and accuracy for discriminating the Mild from the Severe COVID-19 group.
Results
Clinical and laboratory findings
Table 1 shows the demographic and clinical data of 102 patients at the time of admission. A total of 102 patients were included in this study 84 in the Mild group and 18 in the Severe group, with respective average ages of 43.70 and 52.83 (P = 0.004) and male/female ratios of 43/41 and 10/8. The average body temperature of the patients was 37.5 °C (Mild group) and 37.8 °C (Severe group), and no statistical difference was found (P= 0.464). The most common clinical symptoms were cough (72/102, 70.59%) and fever (86/102, 84.31%). The time from onset of symptoms and respiratory rate in the Severe group were higher than that of the Mild group, while the blood oxygen saturation was decreased in the former group (P< 0.05). Only three patients in the Severe group needed mechanical ventilation, while none in the Mild group needed ventilatory support. The percentage and absolute lymphocyte counts were lower in the Severe group (P<0.001). The percentage of neutrophils and serum concentrations of hypersensitive C-reactive protein (HSCRP) and procalcitonin (PCT) were higher in Severe group in comparison with the Mild group (P<0.001).
table ft1table-wrap mode=article t1
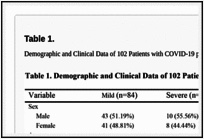
Table 1.
caption a4
Demographic and Clinical Data of 102 Patients with COVID-19 pneumonia
Imaging Findings
The inter-reader ICCs for CT-SS was excellent (n=102, ICCmedian=0.925, ICCmean=0.936). The scores provided by one of the two readers was randomly chosen for further analyses. Figure 1 displays the total number of patients with lung opacities in each of the lung segments. Overall, the posterior segment of the upper lobes (left, 68/102 [66.7%]; right, 68/102 [66.7%]), the superior segment of the lower lobes (left, 79/102 [77.5%]; right, 79/102 [77.5%]), the lateral basal segments of the lower lobes (left, 79/102 [77.5%]; right, 70/102 [68.6%]), and the posterior basal segments of the lower lobes (left, 81/102 [79.4%]; right, 83/102 [81.4%]) are the most frequently involved sites in COVID-19. There were significant differences between the Mild and Severe groups lung opacity scoring in each lung region, P<0.05 (Table 2). The left lung score was 6.0 (3.0, 8.0), right lung score was 6.0 (3.45, 8.0) and total CT-SS was 13.0 (6.0, 16.0) in the Mild group, while the left lung score was 12.0 (9.0, 14.0), right lung score was 12.0 (9.0, 16.05), and total CT-SS was 23.5 (20.95, 30.05) in the Severe group (Table 2, Figure 2 and Figure 3). The lower lobe scores were higher than the middle-upper lobe scores in each group. However, there were no significant differences between left and right lung scores (Table 3). Pleural effusions were found in 7 cases and lymphadenopathy in 2 cases in the Severe group, while pleural effusion and lymphadenopathy were not found in the Mild group (Table 4).
fig ft0fig mode=article f1
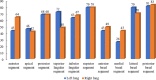
Figure 1.
caption a4
Number of patients involved in each lung segment.
table ft1table-wrap mode=article t1

Table 2.
caption a4
Comparison of scores of each lung segment between the two groups
fig ft0fig mode=article f1
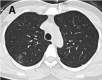
Figure 2a.
caption a4
A-C. Non-contrast chest CT images of a 46 year old woman with mild COVID-19 pneumonia. CT scans show ground-glass opacities in the posterior segment of right upper lobe, superior segment of bilateral lungs and posterior basal segment of right left lobe, …
fig ft0fig mode=article f1
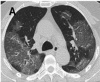
Figure 3a.
caption a4
A-C. Non-contrast chest CT images of a 56 year old man with severe COVID-19 pneumonia. CT scans show multiple ground-glass opacities in multiple lung segments, the CT-SS is 28. D-F. Non-contrast chest CT images of a 69 year old man with severe COVID-19 …
table ft1table-wrap mode=article t1
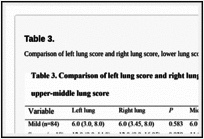
Table 3.
caption a4
Comparison of left lung score and right lung score, lower lung score and upper-middle lung score
table ft1table-wrap mode=article t1

Table 4.
caption a4
Secondary CT Findings of 102 Patients with COVID-19
fig ft0fig mode=article f1

Figure 2b.
caption a4
A-C. Non-contrast chest CT images of a 46 year old woman with mild COVID-19 pneumonia. CT scans show ground-glass opacities in the posterior segment of right upper lobe, superior segment of bilateral lungs and posterior basal segment of right left lobe, …
fig ft0fig mode=article f1

Figure 2c.
caption a4
A-C. Non-contrast chest CT images of a 46 year old woman with mild COVID-19 pneumonia. CT scans show ground-glass opacities in the posterior segment of right upper lobe, superior segment of bilateral lungs and posterior basal segment of right left lobe, …
fig ft0fig mode=article f1
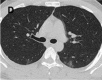
Figure 2d.
caption a4
A-C. Non-contrast chest CT images of a 46 year old woman with mild COVID-19 pneumonia. CT scans show ground-glass opacities in the posterior segment of right upper lobe, superior segment of bilateral lungs and posterior basal segment of right left lobe, …
fig ft0fig mode=article f1
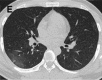
Figure 2e.
caption a4
A-C. Non-contrast chest CT images of a 46 year old woman with mild COVID-19 pneumonia. CT scans show ground-glass opacities in the posterior segment of right upper lobe, superior segment of bilateral lungs and posterior basal segment of right left lobe, …
fig ft0fig mode=article f1

Figure 2f.
caption a4
A-C. Non-contrast chest CT images of a 46 year old woman with mild COVID-19 pneumonia. CT scans show ground-glass opacities in the posterior segment of right upper lobe, superior segment of bilateral lungs and posterior basal segment of right left lobe, …
fig ft0fig mode=article f1
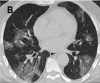
Figure 3b.
caption a4
A-C. Non-contrast chest CT images of a 56 year old man with severe COVID-19 pneumonia. CT scans show multiple ground-glass opacities in multiple lung segments, the CT-SS is 28. D-F. Non-contrast chest CT images of a 69 year old man with severe COVID-19 …
fig ft0fig mode=article f1

Figure 3c.
caption a4
A-C. Non-contrast chest CT images of a 56 year old man with severe COVID-19 pneumonia. CT scans show multiple ground-glass opacities in multiple lung segments, the CT-SS is 28. D-F. Non-contrast chest CT images of a 69 year old man with severe COVID-19 …
fig ft0fig mode=article f1

Figure 3d.
caption a4
A-C. Non-contrast chest CT images of a 56 year old man with severe COVID-19 pneumonia. CT scans show multiple ground-glass opacities in multiple lung segments, the CT-SS is 28. D-F. Non-contrast chest CT images of a 69 year old man with severe COVID-19 …
fig ft0fig mode=article f1

Figure 3e.
caption a4
A-C. Non-contrast chest CT images of a 56 year old man with severe COVID-19 pneumonia. CT scans show multiple ground-glass opacities in multiple lung segments, the CT-SS is 28. D-F. Non-contrast chest CT images of a 69 year old man with severe COVID-19 …
fig ft0fig mode=article f1

Figure 3f.
caption a4
A-C. Non-contrast chest CT images of a 56 year old man with severe COVID-19 pneumonia. CT scans show multiple ground-glass opacities in multiple lung segments, the CT-SS is 28. D-F. Non-contrast chest CT images of a 69 year old man with severe COVID-19 …
ROC Curve for CT-SS


